



Seriously, watch this video it talks about real estate billionaires, newspapers, and a cool marketing tactic you can use.
What’s One Thing Successful Real Estate Agents Have In Common?
Remember when we talked about those billionaire real estate agents awhile back?
The secret almost all real estate billionaires have is that they find a way to get the media talking about them.
They realize that the hardest part of every business is getting people to know your name for the 1st time.
The hardest part of real estate
is getting people to hear about you for the 1st time.
And, you really don’t have to look that hard to see it in action….
- Trump: Running for president
- Fredrik Eklund: On TV
- John Altman: On TV
These “stars” know the secret to success is to get the media talking about them.
But how do you do that?
You might be sitting there from Iowa, New Mexico, or Nebraska thinking:
“Tyler, this is great. But I’m a low-level agent from Nebraska. How can I even begin getting the press to talk about me?”
You can get press too. And this does work in Nebraska.
Here’s the key:
The media only talks about you if you give them what they want.
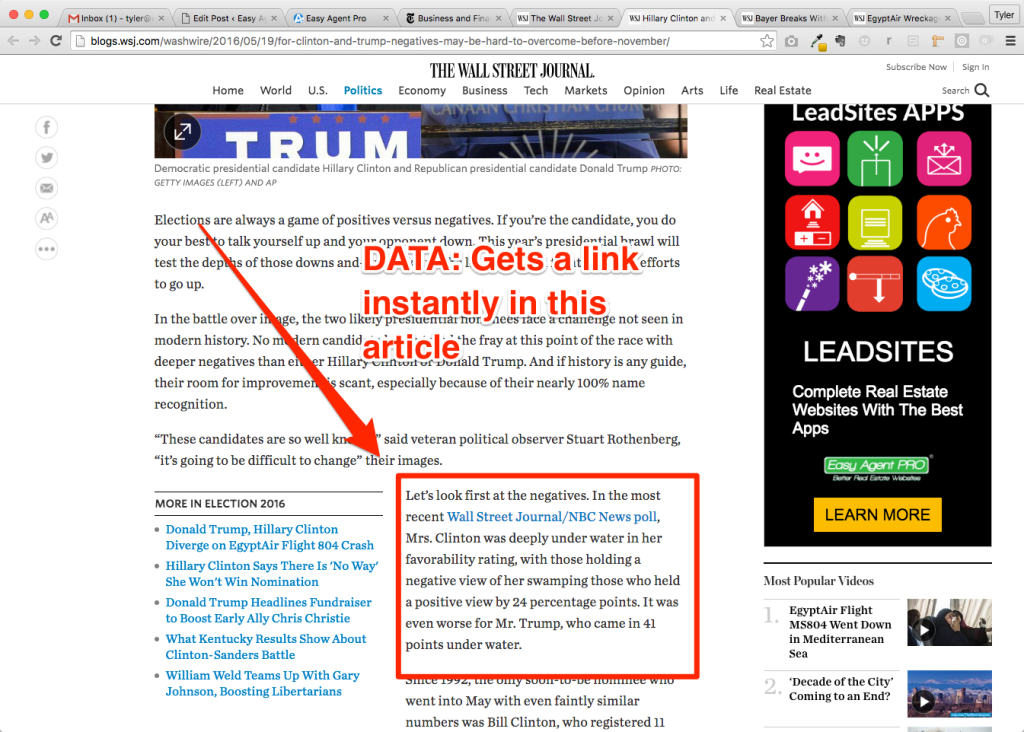
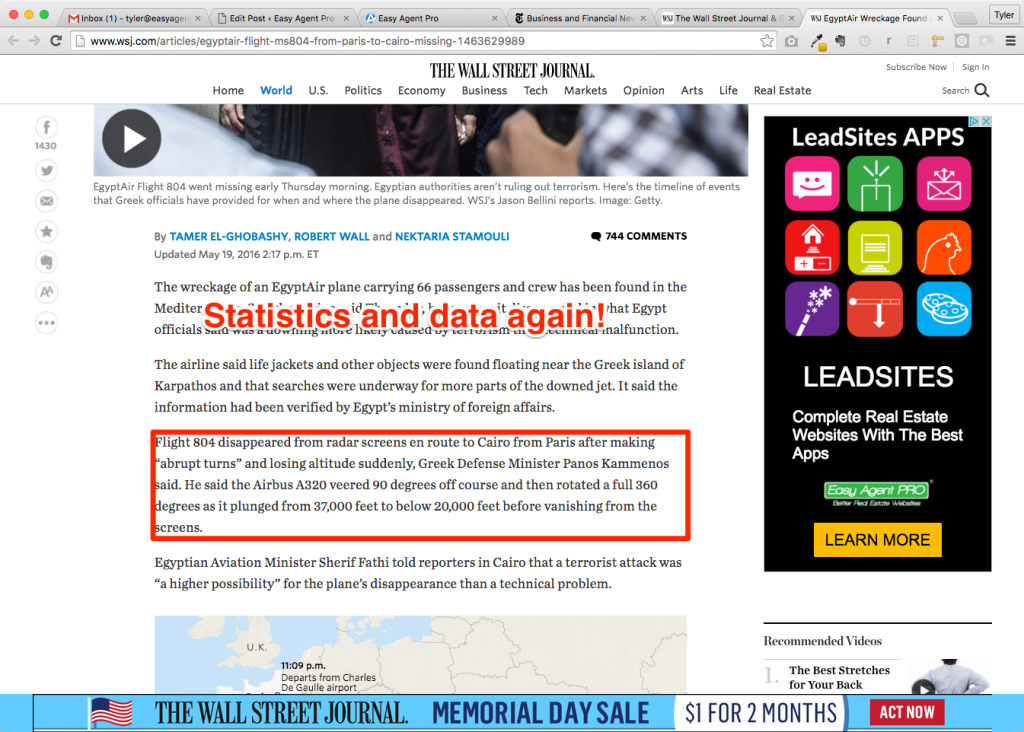
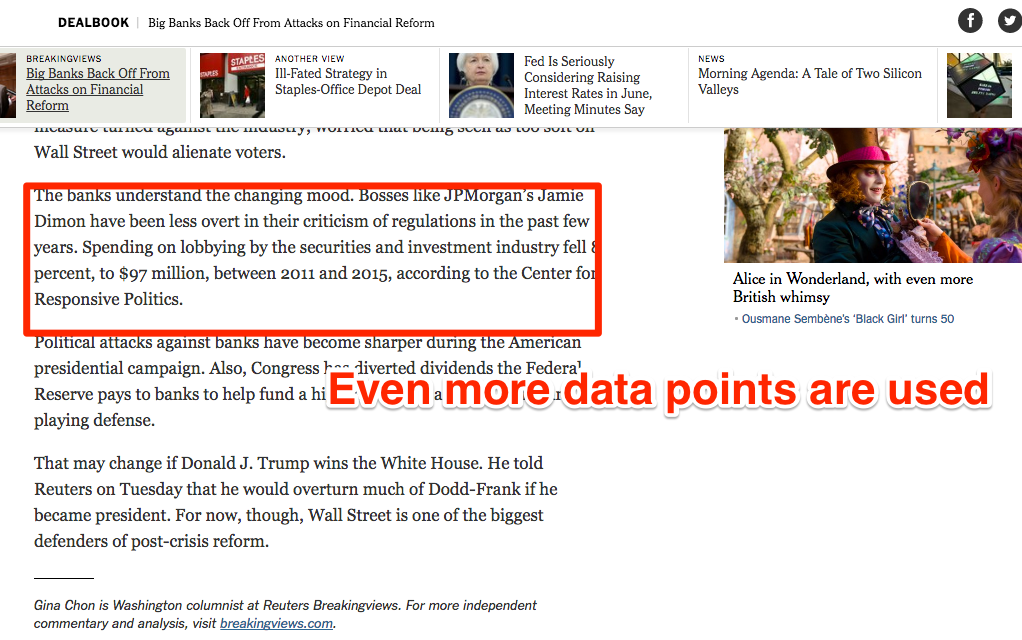
And what’s the media want? They want data points. The media ? LOVES ? data.
Look at these articles:
Example #1: Wall Street Journal
Example #2: Wall Street Journal
Example #3: New York Times
But why does the media love data?
Newspapers and people where you’d love to get mentioned love data points because it makes their articles easier. They have to create a ton of content. And it gets hard to come up with topics. If you can generate interesting data, that instantly gives them something to write about. Sure, this isn’t going to instantly make you a real estate billionaire. But most self made successful agents know how to market themselves in a way that is cost effective.
Media Outlets Will Write About You
If You Compile Useful Data About Your Market!
The best way to do this in 2016 is with Infographics!
Why infographics?
— Short answer —
Infographics Are 30X More
Likely To Be Read Than A Text Article
If you’re new to them, they can seem complicated and time-consuming, but infographics are incredibly valuable for your marketing efforts and can help you tap a large audience when you provide the best data and find the perfect story to tell.
See, the thing about infographics is that they can take a tedious or overly-complex topic and turn it into an engaging experience for viewers.
Through an infographic, you can break down the key elements of your subject to easily digestible bites of information for your audience to consume and, most importantly, share.
Take a look at how communication has changed and evolved over the last decade, or even the last 5 years. The internet, particularly social networking, has changed everything and most of all has transformed the way we receive and share information with one another.
Posts, Tweets, Pins..social media has digitized communication and made it hugely visual. The Vine platform has users communicate with six second videos, while the Snapchat messaging app is quickly becoming the most popular social media platform in the world.
Fun fact – the company recently turned down a $3 billion dollar buyout from Facebook (Source). Sound crazy? Well, maybe it is, but there are actually a few things that we as markerters can learn from Snapchat, especially when it comes to putting together captivating, highly-shareable infographics.
Snapchat lets users take a photo and video and then add a caption or graphic over it. From there, you send it out to friends. You can also add it to your “story” which is a collection of photos and videos that your followers will have access to for 24 hours.
The takeaway here is that Snapchat is about storytelling. And while this is an age-old craft, Snapchat has reinvented it for a new generation and it’s working! It’s working so well that the company would rather keep growing their app instead of selling it to Zuckerberg, even though they’ve been offered $2 billion more than what Facebook eventually spent to purchase Instagram.
So, what makes an infographic engaging? While it’s true that all successful infographics are unique in style and content, they also all have some important things in common that make them an intuitive source of information.
Infographics Are 30X More Likely
To Be Read Than A Text Article!
To start, an infographic is 30 times more likely to be read as a text article (are you still reading?), which makes a lot of sense when you consider that 90% of information that is transmitted to the brain is visual and that our brains process visuals 60,000 times faster than text (Source).
To get you going, check out these Free templates from hubspot. We’re going to go through the key components to include and what aspects come together to create the perfect infographic that your network will love and want to share with others.
#1) Tell A Story
The first thing you’re going to want to do is choose a topic. Your subject should be important to both your industry and audience. Keeping things relevant will help to attract the most qualified readers to your content.
And keep your goals in mind too.
With your infographic you are out to accomplish two things.
- Provide value to your visitors
- Create something that is easily shareable and likely to spread
Because the thing about infographics is that they can be shared across social media channels, so the more people who share, the more leads that are likely to gain value from your infographic and continue to spread the word.
And remember, the thing that is going to make your infographic appealing is the story that you tell through it. If you already have a real estate blog, check out which posts have the most Likes, Shares or Comments. What content of yours is driving the most traffic or getting the most Pins on Pinterest?
Take a little time to look at real estate and related infographics that already exist. You can find them on Pinterest, or through a simple Google search. Now, think about a topic that you haven’t seen presented as an infographic. This will make your data even more innovative and unique.
#2) Data/Content
After you’ve chosen your topic, it’s time to dig into researching the subject and collecting relevant data. The name says it all, folks. INFO-graphic. So your content will be data-dense, which is great. Hard facts and figures go along way in marketing. It’s pretty difficult to dispute accurate stats, so providing these resources to your audience can help establish your credibility as an expert in your topic and industry.
You should vet your sources thoroughly to make sure that the content is not only reliable and helpful, but also current. Outdated numbers aren’t going to do you or your viewers any good.
While you’re collecting your research, be sure to hang onto the original source so you can cite all of it at the end of your infographic.
This is how folks will know that your figures are sound. Plus, if they’re particularly interested in a statistic, they can find out more about it–even more value that you’re providing!
#3) Presentation
Simple, yet creative. In order to have your story unfold seamlessly, you need to make sure that your design is simple so it can flow and all of the components can connect.
When it comes to infographics, less is often more because chances are these date-driven graphics are already going to be full of reliable statistics and content so take it easy on the style and design.
Where to get these infographics?
Step 1 is to assemble some data from your MLS sources on the local real estate market. This can include:
- Average time on market
- Average selling price
- Neighborhood specific selling prices
- Percentage over/under asking price
- Rental market statistics
The next step is to find someone to design you an infographic.
Here are several sources I’ve found for you:
- Fiverr: This is the cost effective solution. I’ve ordered a few infographics off of this website for $5-10 in the past. You can look at them here. If you’re on a budget, these can get you by. You won’t get the best design. But it will be better than nothing.
- Canva: Canva has some useable infographic templates that you can easily edit. And then share with their free online editor
- Freelancer: This website is one of my favorite outsourcing website. You should be able to find a highly qualified designer here at almost any budget. If you have slightly more money to spend, I recommend getting your infographic designed here.
- 99Designs: This website is probably going to be the most expensive option. But you’ll find a very high quality infographic that you can easily use month after month.
What’s next?
Wondering what to do next? Sean asked the same question! The above video shows you how to market your infographic!
After you have your infographic, it’s all about branding and promotion. I suggest sharing it all over social media (here’s a schedule if you need one), emailing it to us at Easy Agent Pro (tyler AT easyagentpro.com) so we can review it, and then getting in touch with local reporters.
You can find local beat writers easily on LinkedIn. These are the people you need to help with your infographic data. Be sure to reach out to them, compliment their historical work, and then slowly introduce them to your work in real estate.
The secret that most real estate billionaires have is that they’re willing to play the long-term game with media in exchange for free press. They understand the value free marketing can add to their business. And knows how to turn their MLS data into useful marketing material.